Does Weekly Consistency Matter? Analyzing Fantasy Football with Statistics and Computer Simulations.
- Larry Strenger
- Sep 4, 2020
- 6 min read
Updated: Sep 7, 2020
When discussing a player's fantasy value, one topic that often rears its head is their "weekly consistency". For years ESPN has published the end-of-year consistency rankings, which identifies the players that have performed well on a weekly basis over the season. The Fantasy Footballers often bring it up when discussing roster construction and "the truth" about different players yearly performances. They also include weekly consistency charts in their ultimate draft kit. FantasyPros has a whole spreadsheet analyzing players weekly consistency as well.
In the fantasy world, these questions seem all too common: "Does my receiver only do well during the weeks he catches long touchdown passes? Can I rely on this guy to get me at least 10 points a game? Can I count on my team to perform week in and week out?". However, one very important question is rarely asked: "Does my players' weekly consistency actually matter at all? Does it actually affect my team's chances at winning a championship?". I have decided to delve deep and answer this question with a bit of statistical analysis and computer simulation.

Raheem Mostert (left) and Le'Veon Bell (right) both finished 2019 as top 30 running backs. While the two had very similar end-of-season scores in standard fantasy leagues, Bell was far more consistent week-to-week than Mostert.
What I did:
Brief Warning: If you are just trying to find out whether or not weekly consistency matters in fantasy football, you should probably just skip to the "Results" section. The "What I did" section is just a technical discussion of the design and methodology behind the statistics and simulation used in this study. Also, this section uses half-point ppr data for examples, numbers, and diagrams.
Now for the nerds who decided to read the rest of this section, I am going to get into how the statistics and simulation worked. First, I acquired weekly and yearly player performance data from https://github.com/fantasydatapros/data. For each of the past five years, I found the top 12 QBs, top 30 RBs, top 30 WRs, and top 12 TEs, and I took their weekly scores for the weeks in which they were active. I then found the average weekly score of these players by position (QB: 19.15; RB: 12.94; WR: 12.87; TE: 10.13). Once I had the average, I went through the weekly stats of each player and scaled their scores, so that all players of a single position had an identical weekly average on a season.
For example, here's the distribution of Michael Thomas's 2019 weekly scores before scaling:

Here's the distribution of Michael Thomas's weekly scores after scaling to the 12.87 average:

As you can see, the shape of a player's distribution remains the same, but the magnitude is changed. This scaling was done to make scoring equal between all players of a position (same mean outcome) apart from their week-to-week consistency, as this study is simply meant to test whether a player's weekly variability affects a team's title chances.
After scaling, I separated different position's players into two halves for each year, the half with the higher variance and the half with lower variance. I then complied the weekly scores of all high variance and all low variance players into two different distributions for each position.
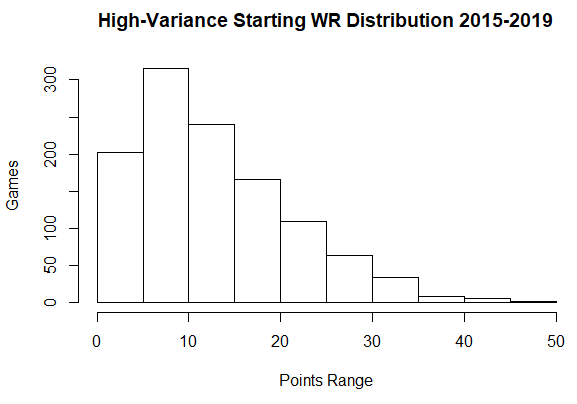
Here is the high-variance WR point distribution:

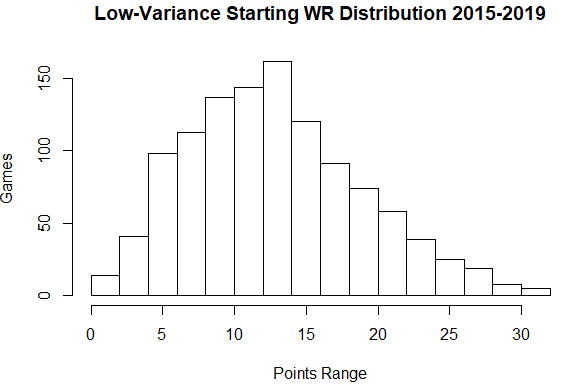
Here is the low-variance WR point distribution:

The mean of these distributions is the same (12.87 points); however the variance differs greatly (72.21 vs 36.90 points squared). The same is true for the high and low variance distributions of each other position.
After determining these distributions, it was time to create the simulated season. This was fairly simple, I created 12 teams. Each team had 7 players: 1 QB, 2 RBs, 2 WRs, 1 Flex (combination of RB's and WR's distributions), and 1 TE. Then, in each simulated season, I randomly assign each of the teams' players the label of "consistent" or "inconsistent". For each game, a team's score is generated by sampling from either the the low-variance ("consistent") or high-variance ("inconsistent") distributions for each player's position depending on the label they were assigned.
For example, when generating the weekly score of a team with all consistent players:
The team's score = a sample from the consistent QB distribution + 2 samples from the consistent RB distribution + 2 samples from the consistent WR distribution + a sample from the combined consistent WR and RB distribution + a sample from the consistent TE distribution
The simulated season goes just like a regular 12-team league's season would. The twelve teams play against one another in a thirteen-game regular season (in each game, the teams' scores are generated in the way as described above). The top six teams of the regular season season then play against each other in a 3 round playoff in the top two seeds are given a bye. At the end of each season, one team wins the championship and their specific roster combination of consistent and inconsistent players is recorded.
Results:
After running the simulation for 100,000 iterations with half-point ppr data, the results are shown below:

From this plot, it is clear to see there is no apparent relationship (whether positive or negative) between a team's weekly variance and championship success. There was a correlation of -.04 between the number of championships and a team's variance in half-point ppr (which is a very low/insignificant correlation). Similar results were found for the other scoring formats with the ppr and standard team's success having correlations of -.01 and .05 with weekly scoring variance respectively (again, VERY insignificant).
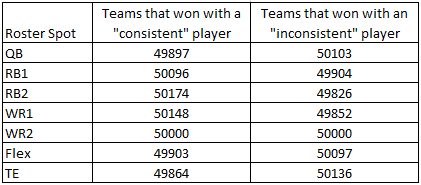
When looking at the impact of consistency by position, having a "consistent" or "inconsistent" player had no significant affect on the team's championship success for any of the positions in any format (per the Mann-Whitney U test with a significant p-value of < .1).
The number of championship teams with "consistent" and "inconsistent" players at each roster position for half-point ppr simulations is shown below:

Why does this matter:
All this study really does is reinforce the simplest rule of all about player selection: ACQUIRE AND PLAY THE PLAYERS YOU EXPECT TO SCORE THE MOST POINTS! It does not matter how a player performs on any single week as long as their average (mean) points per week remain high over the year.
A lot us fantasy players and even professional analysts try to get cute with our trades and start-sit decisions by considering weekly consistency as a factor. Personally, I think individuals do this because it "feels bad" when you have an inconsistent player starting in your lineup. Please ignore this feeling and stick to the what the numbers say! From this study's results, it is clear weekly consistency should not be used as a factor in decision-making. In addition, it may be beneficial to target inconsistent players in trades as others in your league may be devaluing them (as long as you expect that player's average points too be high over the course of the season).
Keep in mind, this study is for week to week consistency, not yearly consistency. It does not mean you should trade for players who under-perform at the beginning of a season. In addition, this study only really applies starting-level inconsistent players with a proven track record of high seasonal production (consistently inconsistent players). Being a one week wonder on the waiver wire does not count as inconsistency. It counts as fluke. You must expect a player to average high numbers over the season; it just may happen in a series booms and busts.
Assumptions:
A handful of assumptions were made for this computer simulation. While I do not believe any of them have a significant affect on the validity of the studies findings, it is still important to define what these assumptions were.
-This study uses the top 12 QBs, top 30 RBs, top 30 WRs, and top 12 TEs from each year to model the weekly scoring distributions for the positions; however, more than just these players were started in fantasy leagues. It also assumes half of the players at each position can be classified as "consistent" and half "inconsistent". In real life, it will likely not be such an even split.
-As the simulation randomly samples from the scoring distributions to determine a players the weekly performance, it assumes there is no degree of predictability about where a player will perform in their distribution each week. In real life, there may be indicators such as match-up, news, and injury status that can help owners predict some of the variability in a players performance.
-This simulation also assumes that all teams will score, on average, the same number of points each week. In a real league, there will be better teams that are average more points and worse teams that average less.
By: Lawrence Strenger @fantasystatdude
To say updated on our new articles, please subscribe on our homepage or follow @fantasystatdude on twitter.
If you are interested in contributing to the Stat House, feel free to send us a message located at the bottom of our homepage.


Comments